Imagine you are analysing a value stream and instruct your team to create a VSM (Value Stream Map) for any kind of administrative or software development process. When you return a couple of hours later, all you see is a giant flow chart. “That’s not a VSM, that’s a Flow Chart”, you might say. But usually you will get an answer like “Isn’t that the same?”. No it isn’t! And for that reason I like to explain the difference between these tools.
VSM: The Good
Value Stream Mapping visualizes a value stream and helps you
- to identify the reason for long lead times,
- to detect bottlenecks in the process,
- to see coordination problems between process steps, and
- to create a common understanding how the flow should be.
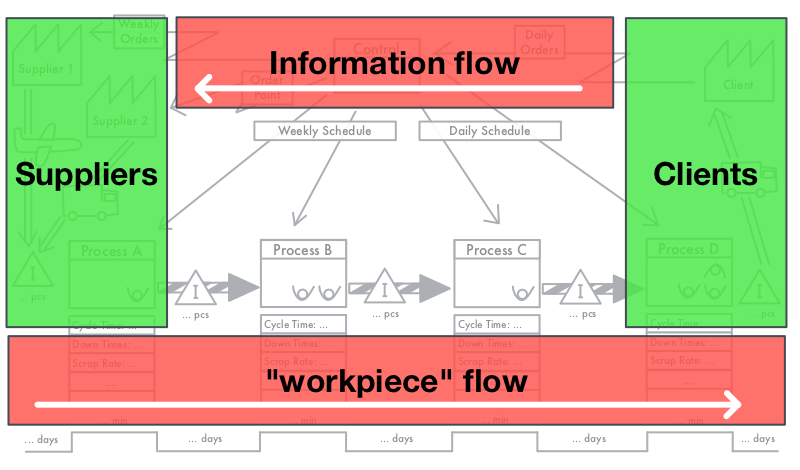
So in order to build a VSM you need something that flows. While it is easy to identify the flow in a factory, it might be harder to see it in non manufacturing areas. But there is always some “workpiece” that flows: Sales orders, service orders, client requests, change request, incidents or patients. You just have to look a bit more carefully.
Once you got your “workpiece” the VSM exercise gets easier. Map the process steps at the bottom of your map, from left to right. Then add some information about the steps (like cycle times, number of workers, etc.) as well as the inventory/backlog of “workpieces” between the steps. Finally include the information flow at the top, from right to left, so you can see how work between steps is being coordinated.
Swimlane: The Bad
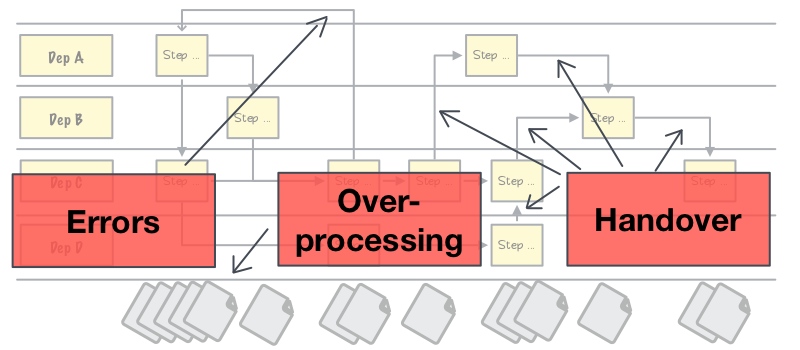
Swimlane is basically a less detailed flow chart where all boxes for a specific department or person are put into a dedicated lane. So it helps you
- to identify Handovers (which are a type of waste),
- to see areas where a lot of errors occur (usually by having arrow pointing backwards),
- to visualize all necessary and unnecessary the paperwork, and
- to get a pretty good idea how the process works and should work in detail.
To build a Swimlane chart is quite easy. First you identify all departments/people involved and create a lane for each one of them. Then you talk your team through the process while drawing the work and decision boxes. Finally you hang all the reports and paperwork which is being used or generated below the Swimlane.
Flowchart: The Ugly
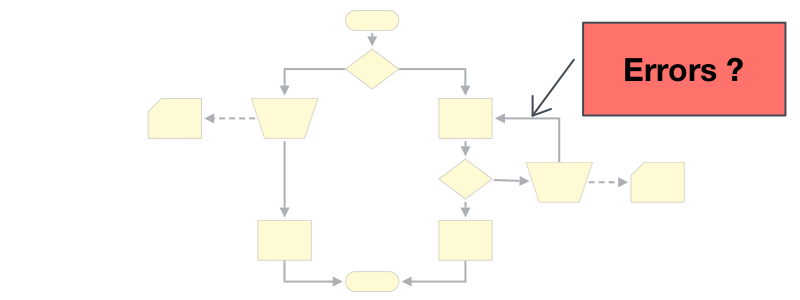
Almost anyone knows a Flowchart. So there is not much to say about it. Usually it is a Swimlanewithout the lanes and the documents. Most of the times it is also more detailed than a Swimlane chart and covers any eventuality in the process.
So what’s the difference?
Each tool has its own purpose. So it is important to known what you want to achieve before investing time to create any one of them.
VSM is definitely the best tool if you want to see the flow of your workpieces. As a result you easily understand the reason for long lead times and low overall productivity. It also helps to create a common understanding of your future state and how you want to get there.
Swimlanes is the perfect tool for waste hunting in administrative processes, because you see a couple of wastes right away (Handovers, Errors and Overprocessing) and can easily design a new process which reduces them.
Flowchart is best suited if you want to communicate your process to a software developer. In order to automate any kind of activity in an IT system, you really need to know all the ifs and thens. Flowcharts are doing this perfectly.
So there is no best tool at all. But if you want to have a tool which guides you through your Lean journey, VSM is the way to go.