Skip to content
Menu
Leanguru.pro Leanguru
  • About & Disclaimer
Leanguru.pro Leanguru
Explanation of the Cumulative Flow Diagram

The Cumulative Flow Chart (CFD) in a nutshell

Posted on 06/08/201531/10/2018 by Christian Gut

The Cumulative Flow Diagram (CFD) is one of the most powerful inventions in terms of process visualisations I have ever met so far. Coming from the IT community, its main purpose is to show how an IT project is progressing.

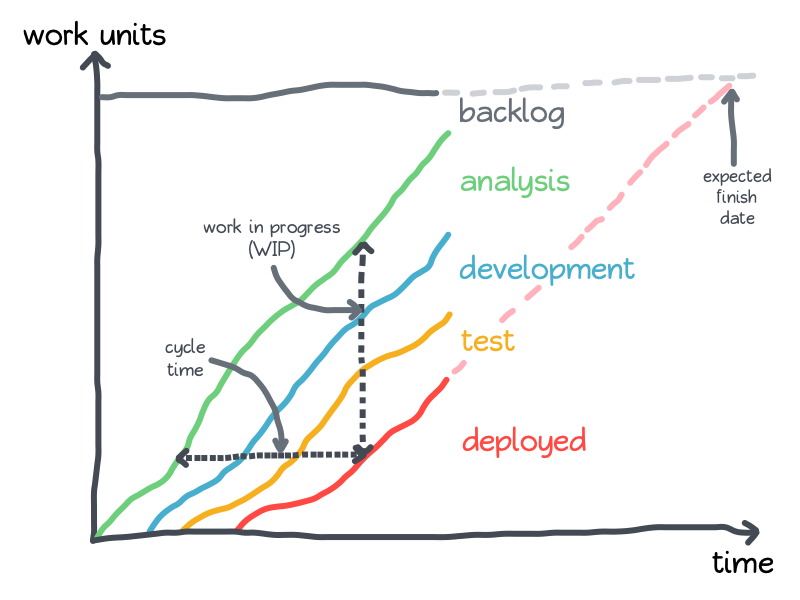
Those projects are usually dividable into smaller work units (i.e. functionalities, user cases or histories) which follow a predefined workflow, containing steps like analysis, development, test and deployment. The CFD maps the quantity of those work units on a time axis.

This allows for an estimation of expected delivery dates by projecting the intersection between the lines related to each workflow state with the backlog line on the top of the diagram. It also gives a quick view on the amount of work in progress (WIP) as well as cycle times, defined by the elapsed amount of time between analysing a work unit and deploying it into production.

In general it can be seen as a upside-down Burn-Down-Chart with additional information about each step in the workflow.

Ilustration of Cumulative Flow Diagram
Illustration of Cumulative Flow Diagram (CFD)

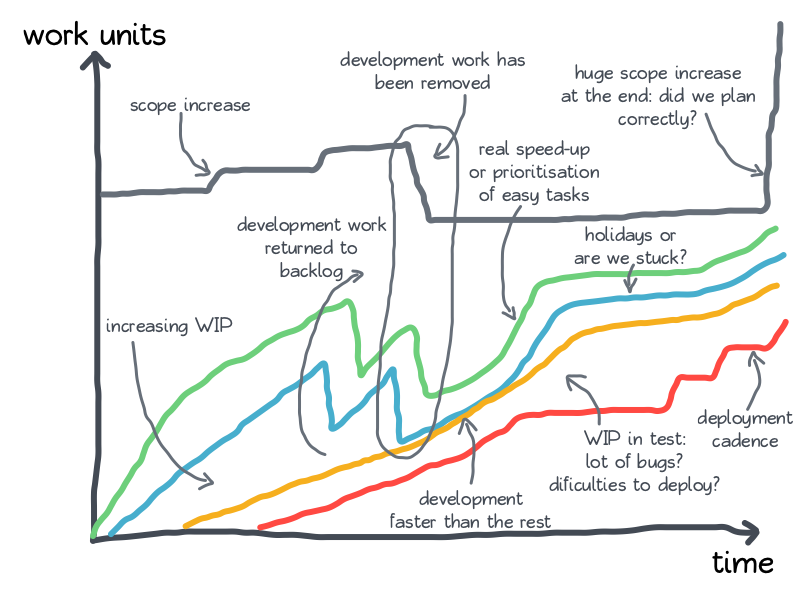
However, the fact that the chart is upside-down and that it visualizes each step makes it very powerful. Pavel Brodzinski wrote an excellent and extensive article about what can happen to your CFD. I tried to summarise most messages of this article into one (not so) simple diagram.

Cheat Sheet for the Cumulative Flow Diagram

Leave a Reply Cancel reply

Your email address will not be published. Required fields are marked *

Recent Posts

  • The Cumulative Flow Chart (CFD) in a nutshell
  • The D in PDCA stands for Do, not Discuss
  • Comments from Mike Orzen about Value Stream Mapping in Lean IT
  • Case Study – Kanban board for a purchasing & import department
  • No Gantt Diagrams please – SO&P in Manufacturing and Services

Recent Comments

  • Visual Management for Maintenance Operations | Visual Workplace Resource Center on Visual Management for Maintenance Operations
  • Christian Gut on WIP limits matter
  • Charu on WIP limits matter
  • Christian Gut on Visual Management for Maintenance Operations
  • Keith Barr on Visual Management for Maintenance Operations

Archives

  • August 2015
  • January 2015
  • July 2014
  • June 2014
  • May 2014

Categories

  • Lean IT
  • Lean Manufacturing
  • Lean Principles
  • Lean Services
  • Lean Tools
  • Uncategorized

Meta

  • Log in
  • Entries feed
  • Comments feed
  • WordPress.org
©2023 Leanguru | Powered by WordPress & Superb Themes